
Is your website performance killing your business?
Why Page Load Speed is so Important
Bounce rate, conversion, retention, online sales, and SEO - all critical metrics that your online success is dependent on. Among the many variables that determine those metrics, the number one is now page load speed. Have a look at these stats to understand why the need for speed applies to your digital experience as much as it does to a Formula One racing team.
Mobile phone stats from a 2017 Google study:
- A 2-second increase in load time increases the probability of bounce by 32%
- A 4-second increase in load time increases the probability of bounce by 90%
Web stats:
- 79% of web shoppers who are dissatisfied with website performance are less likely to buy from the same site again and are 27% less likely to buy from the same site’s physical store. (2009 Akamai study)
- Users will visit a Web site less if its loading time is slower than its competitors by 250 milliseconds, or one-quarter of a second. That is less time than a single-eye blink. (NY Times, 2012)
- A 1-second delay in page load time equals 11% fewer page views, a 16% decrease in customer satisfaction, and 7% loss in conversions. (2008 Aberdeen Research Group study)
These studies are now 4-14 years old. Despite the fact that these stats have been quoted 1,000s of times in countless articles in the last decade, average site speeds are still below what should have been considered the minimum acceptable standard 5 years ago. Users have become much more demanding and a lot less patient since the time these tests were done. In the era of Twitter and TikTok attention spans are rapidly approaching zero. If users abandon your site in the first 3 seconds nothing else you have done to create a great digital experience matters.
And now Google, the 900 lb gorilla of internet traffic has upped the page experience ante by putting mobile page load speed at the top of the priority list for user experience and SEO ranking with the Google Core Web Vitals metrics. If page load speed has not been at the top of your priorities list maybe now is the time to reevaluate your priorities.
The Impact of Web Performance on SEO
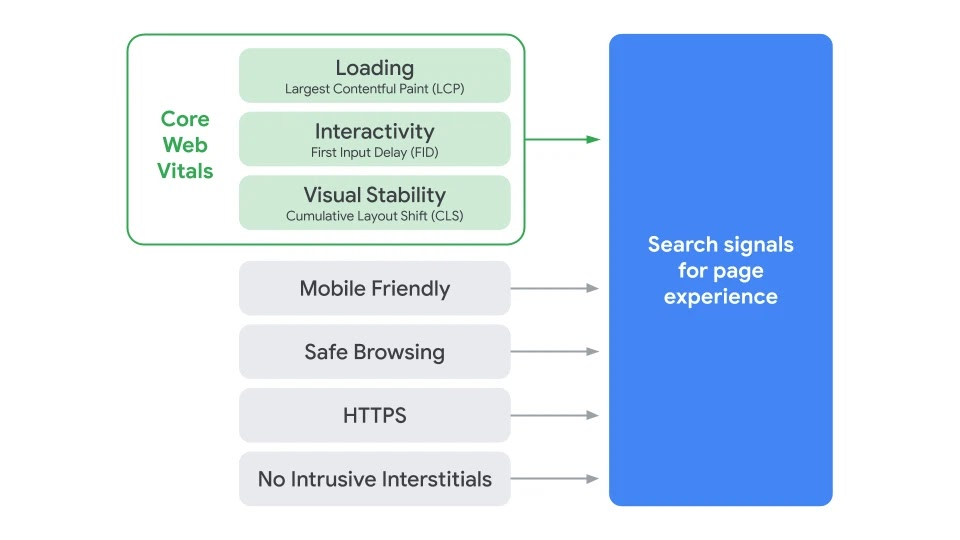
Google continuously strives to deliver the most relevant results and best experience to users and adjusts its algorithms accordingly. This makes Search Engine Optimization a constantly moving target. In May 2021 Google added Core Web Vitals to its existing search signals that already included mobile-friendliness, safe-browsing, HTTPS-security, and intrusive interstitial guidelines.
“The average time it takes to fully load a mobile landing page is 22 seconds, according to a new analysis. Yet 53% of mobile site visitors leave a page that takes longer than 3 seconds to load. That's a big problem.” (Google Mobile Speed study, 2017)
As of 2021 almost half of web traffic in the US originated from mobile devices, and that number is growing rapidly. Google has served notice that it will penalize sites whose mobile page experience is not up to the minimum standards defined by the Google Core Web Vitals. Considering the state of the average site’s mobile performance there is much work to be done.
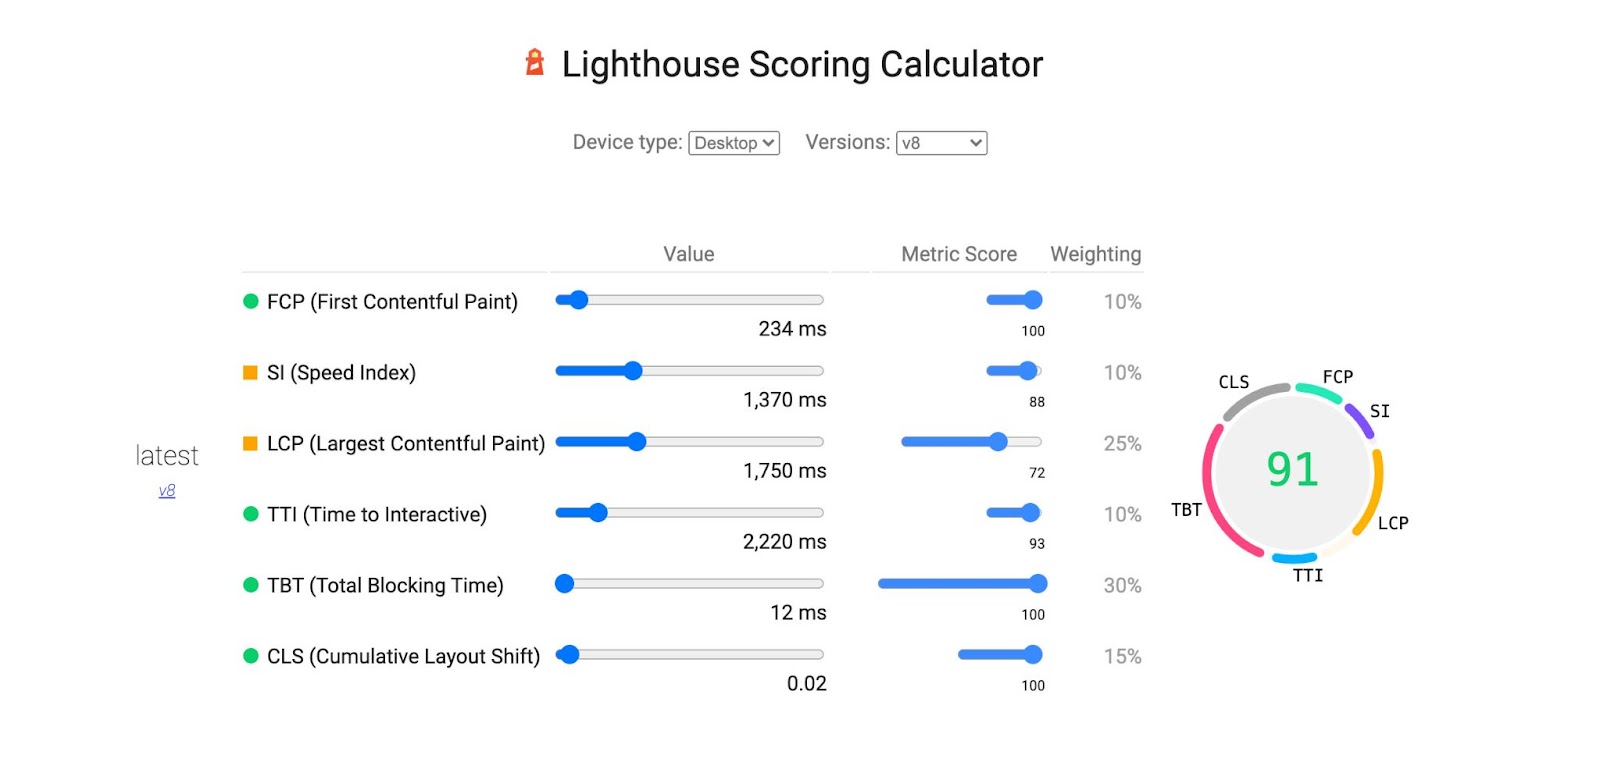
You can test the mobile and web performance of any website using Google’s PageSpeed Insights tool. Google also has a mobile specific tool: Test My Site. PageSpeed Insights will provide a score for mobile and web performance determined by the Lighthouse Scoring Calculator. You can click on the “See Calculator” link in the PSI results page to view the calculator. You can also move the sliders on the calculator to see what impact changes in individual metrics will have on your score.
Below are the average scores of 9 of the biggest eCommerce websites home pages in the USA on June 06/28/2021. According to Google: A score of 90 (green checkmark) or above is considered good. 50 to 90 (orange informational circle) is a score that needs improvement, and below 50 (red warning triangle) is considered poor.
| Website | Mobile Score | Pass Mobile Core Web Vitals? | Web Score | Pass Web Core Web Vitals? |
|---|---|---|---|---|
| Amazon | 70 | yes | 80 | yes |
| Ebay | 53 | yes | 73 | yes |
| Etsy | 75 | no | 90 | no |
| Walmart | 29 | no | 91 | yes |
| Home Depot | 12 | no | 36 | no |
| Target | 34 | no | 60 | no |
| Wayfair | 26 | no | 52 | yes |
| Lowes | 49 | no | 52 | no |
| Best Buy | 9 | no | 38 | no |
It's one year since Google announced its new metrics and one month after Google’s new metrics took effect and yet there are only 2 scores in the 90s in this sample of some of the biggest eCommerce sites in the USA. That represents an opportunity for agile, fast-moving businesses looking for an advantage.
The Metrics Measured by Core Web Vitals
So what metrics does Core Web Vitals measure? The 6 Core Web Vitals metrics are described below with links to their Google pages. Ideally, all your performance scores for each metric will be in the fast category that Google classifies as 'good'.
First Contentful Paint
First Contentful Paint marks the time at which the first text or image is painted.
0–1.8 seconds (fast), 1.8–3 seconds (moderate), over 3 seconds (slow).
Speed Index
Speed Index shows how quickly the contents of a page are visibly populated.
0–3.4 seconds (fast), 3.4–5.8 seconds (moderate), over 5.8 seconds (slow).
Largest Contentful Paint
Largest Contentful Paint marks the time at which the largest text or image is painted.
0-2.5 seconds (fast), 2.5-4 seconds (moderate), over 4 seconds (slow).
Time to Interactive
Time to interactive is the amount of time it takes for the page to become fully interactive.
0-3.8 seconds (fast), 3.9-7.3 seconds (moderate), over 7.3 seconds (slow).
Total Blocking Time
Sum of all time periods between FCP and Time to Interactive, when task length exceeded 50ms, expressed in milliseconds.
0-200 milliseconds (fast), 200-600 milliseconds (moderate), over 600 milliseconds (slow).
Cumulative Layout Shift
Cumulative Layout Shift measures the movement of visible elements within the viewport. Learn more.
< 0.1 (fast), > 0.1 < (moderate), over 7.3 seconds (slow).
Page Load Speed Testing Tools
We use the Google PageSpeed Insights tool because it is Google that determines SEO rank and is usually the key determinant driving web traffic. There are however lots of test tools on the web that can give you useful insights into your page load performance and suggestions on how to improve it. Remember with any of these tools every time you run a test results will vary. You will need to run multiple tests over different times and days to determine what range your page load performance falls into.
10 Page Load Speed testing tools:
Google PageSpeed Insights
Free Google Page Load Speed test.
WebPageTest
Lots of useful free testing tools.
GTmetrix
Free testing tool, advanced features for paying customers.
Uptime
3 free testing tools, 30-day free trial for paid services.
Uptrends
Free testing tool, free trial for paid services.
Dotcom Tools
Free testing tool.
DareBoost
Free testing tool, advanced features for paying customers.
Web Speed Test
Free image analysis tool.
Pingdom
30-day free trial.
Site24x7
30-day free trial.
Page Load Speed Alone isn’t Enough
Once you have the performance to ensure that you won’t lose visitors at the front door, you still need a digital experience that will engage and convert. If you hollow out your user experience to accomplish fast page load times you will have accomplished nothing. The key to success is understanding how to deliver awesome experiences that that load fast enough to provide a seamless, frictionless experience. You have to ace the speed tests while delivering rich, engaging experiences to users.
Delivering high performance, compelling systems of engagement is what we do at Intelifaz. You can sign up for our mailing list, ask a question or arrange a free strategic analysis of your digital needs at our Contact Us page.